Automated System Cycles per Hour: What to Measure
Automated System Cycles per Hour: What to Measure as Heavy Industry Becomes More Data-Led
Automated system cycles per hour is more than a simple throughput figure; it is a practical benchmark for evaluating reliability, equipment utilization, control logic, and process bottlenecks across mining, bulk handling, and heavy-machinery operations.
For researchers comparing autonomous haulage, crushing circuits, material handling systems, or digital-twin performance, knowing what to measure helps separate headline productivity claims from operational reality.
The metric is gaining importance because automation claims are becoming more ambitious, while capital discipline, energy limits, and ESG reporting are becoming stricter.
Why Automated System Cycles per Hour Is Becoming a Strategic Signal
In heavy industry, cycle performance now sits between engineering, finance, safety, and sustainability. A faster cycle is not always a better cycle.
Automated system cycles per hour must be read with load quality, downtime, route conditions, queueing, and energy use. Otherwise, the number becomes misleading.
The trend is visible in autonomous haulage, stacking and reclaiming, conveyor loading, robotic maintenance, and automated crushing control.
Each system may report completed cycles, but the definition of one cycle can vary by equipment type, control software, and site practice.
That variation explains why automated system cycles per hour should be benchmarked with context, not treated as a universal scoreboard.
Current Trend Signals Behind Cycle-Based Benchmarking
Several market signals show why cycle measurement is moving from basic reporting toward operational intelligence.
- Autonomous fleets require repeatable comparisons across shifts, routes, payloads, and traffic rules.
- Digital twins need cycle data to validate simulation accuracy against field behavior.
- Energy reporting links each movement, lift, crush, or transfer to cost and emissions.
- Predictive maintenance depends on cycle frequency, load severity, and abnormal timing patterns.
- Capital planning increasingly compares asset utilization against practical operating constraints.
These signals make automated system cycles per hour a bridge between machine productivity and enterprise-level performance control.
What Counts as a Cycle Depends on the System Boundary
Before comparing automated system cycles per hour, the cycle boundary must be fixed. A vague boundary creates false gains or hidden losses.
For autonomous haulage, one cycle may include loading, travel loaded, dumping, return travel, queueing, and positioning.
For a crushing circuit, one cycle may refer to a controlled feed adjustment, material pass, or process stabilization interval.
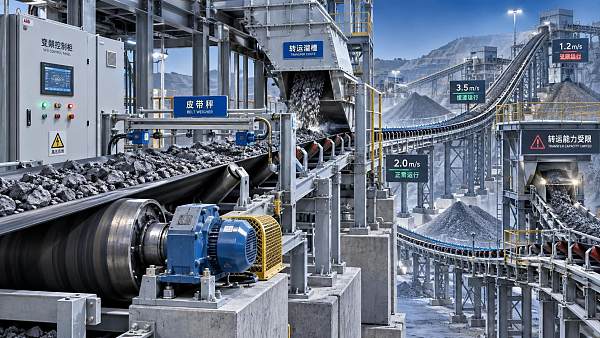
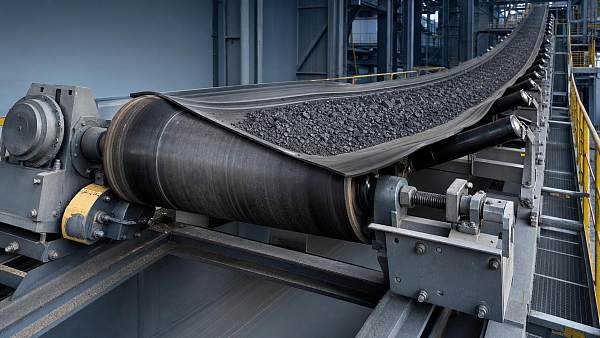
For bulk material handling, one cycle may involve bucket loading, conveyor transfer, stacker movement, reclaiming, or railcar loading.
Because of these differences, automated system cycles per hour should always be paired with a written cycle definition.
Core Metrics That Give Automated System Cycles per Hour Real Meaning
Automated system cycles per hour becomes useful when it is combined with companion metrics. Throughput alone rarely explains performance.
Completed cycles
Completed cycles show how many full actions reached the defined endpoint. This is the base count for automated system cycles per hour.
Average cycle time
Average cycle time reveals whether the system is stable, overloaded, or waiting for upstream and downstream processes.
Cycle time variation
Variation often matters more than averages. High variation indicates congestion, inconsistent material, control instability, or human intervention.
Effective operating time
Effective operating time excludes planned stoppages, safety pauses, maintenance windows, and external delays when required by the benchmark method.
Payload or work quality
A cycle with low payload, poor fragmentation, or incomplete transfer should not be valued equally with a full-quality cycle.
Drivers That Are Reshaping How Cycle Performance Is Judged
The growing focus on automated system cycles per hour is driven by technical, commercial, and regulatory pressures.
These drivers change the question from “How many cycles?” to “How many useful, safe, repeatable, and efficient cycles?”
How the Metric Affects Key Business and Operational Areas
Automated system cycles per hour affects scheduling, maintenance, inventory, energy management, safety analysis, and capital evaluation.
In mine planning, cycle shifts can change fleet balance, loading strategy, dumping capacity, and haul road assumptions.
In mineral processing, cycle irregularity can signal feed instability, crusher chamber constraints, screen loading issues, or control-loop delays.
In bulk handling, automated system cycles per hour helps identify whether bottlenecks sit at loading points, conveyors, transfer stations, or storage yards.
- Higher cycles may increase wear if payload and shock loads are not controlled.
- Lower cycles may be acceptable when energy savings or safety stability improves.
- Stable cycles can reduce buffer stock, idle equipment, and reactive maintenance.
- Erratic cycles can expose poor dispatching, sensor errors, or material variability.
Common Measurement Errors That Create False Productivity Signals
The most common error is counting starts instead of completed cycles. This inflates automated system cycles per hour during interruptions.
Another error is excluding wait time without explaining why. Wait time may be a system problem, not an external inconvenience.
A third error is comparing different payload levels. A fast light cycle may deliver less value than a slower full cycle.
Sensor quality also matters. Missing timestamps, delayed tags, and manual overrides can weaken automated system cycles per hour analysis.
Finally, averages can hide congestion. Percentile analysis often reveals peak-period stress better than a daily mean.
What to Measure Alongside Automated System Cycles per Hour
A practical benchmark should combine cycle quantity, cycle quality, system availability, and resource intensity.
- Cycles per effective operating hour, not only clock hour.
- Tonnes, cubic meters, or work units per cycle.
- Energy consumed per completed cycle.
- Alarm frequency and intervention count per cycle.
- Idle time, queue time, and blocked time.
- Cycle time median, standard deviation, and P90 value.
- Maintenance events per thousand cycles.
This combined view makes automated system cycles per hour suitable for benchmarking, not just dashboard reporting.
Benchmarking Methods That Support Reliable Comparisons
Benchmarking automated system cycles per hour requires consistent time windows, operating modes, and material conditions.
Shift-by-shift analysis shows workforce, traffic, and environmental variation. Hourly analysis reveals short-term instability.
Seasonal analysis helps explain weather, moisture, road quality, and ore-body changes. These factors can shift cycle behavior materially.
Decision Points for Interpreting Rising or Falling Cycle Rates
A rising value for automated system cycles per hour may signal better dispatching, shorter routes, improved control logic, or lighter workload.
It may also signal risky acceleration, incomplete loading, excessive starts, or deferred maintenance pressure.
A falling value may indicate congestion, poor fragmentation, sensor faults, weather impact, route degradation, or conservative safety rules.
It may also reflect deliberate optimization, especially when energy per cycle falls and availability improves.
- Check whether payload changed before judging cycle improvement.
- Compare cycle gains against maintenance alerts and component temperatures.
- Review whether bottlenecks moved to downstream assets.
- Confirm whether control software rules changed during the period.
A Practical Response Framework for the Next Benchmark Cycle
Organizations can improve automated system cycles per hour analysis by applying a disciplined measurement framework.
What to Watch as Automation and Digital Twins Mature
The next phase of automated system cycles per hour measurement will be more predictive and less descriptive.
Instead of only reporting past cycles, systems will forecast cycle risk from traffic, weather, material, and maintenance signals.
Digital twins will compare expected and actual cycles continuously. Deviations will trigger deeper reviews of constraints and assumptions.
Energy-aware automation will also change success criteria. The best cycle rate may be the most profitable sustainable rate.
For heavy machinery and resource operations, automated system cycles per hour will remain essential, but it must be interpreted with discipline.
Next Actions for Stronger Cycle Performance Insight
Start by auditing how automated system cycles per hour is currently defined, captured, and reported across each automated process.
Then add payload, energy, downtime, intervention, and cycle-variation metrics to create a more reliable performance view.
Finally, compare results against historical baselines, similar assets, and digital-twin expectations before making investment or process decisions.
Measured correctly, automated system cycles per hour becomes a decision tool for reliability, productivity, cost control, and operational resilience.
Recommended News
 Sep 30, 2026How diagnostic equipment helps detect conveyor belt faults earlyDiagnostic equipment helps detect conveyor belt faults early by tracking heat, vibration, alignment, and drive performance—supporting safer maintenance and less downtime.
 Sep 12, 2026Which SCADA performance metrics reveal conveyor bottlenecks early?SCADA performance metrics reveal conveyor bottlenecks early through throughput variance, drive load, speed deviation, transfer delays, and alarm sequences. Learn what to monitor.
 Jul 11, 2026Best Pneumatic Conveying System Supplier for Fly Ash ProjectsFind the best pneumatic conveying system supplier for fly ash with proven engineering, lower wear, dust control, and reliable performance for efficient, compliant projects.
 Jul 03, 2026Running Tension Conveyor Belt: Signs Your System Is Set WrongRunning tension conveyor belt issues often appear as drift, slip, spillage, or wear before failure. Learn the warning signs, site-specific causes, and how to correct settings fast.